Election Results Map
Interactive visualisation tool of Slovak election results.
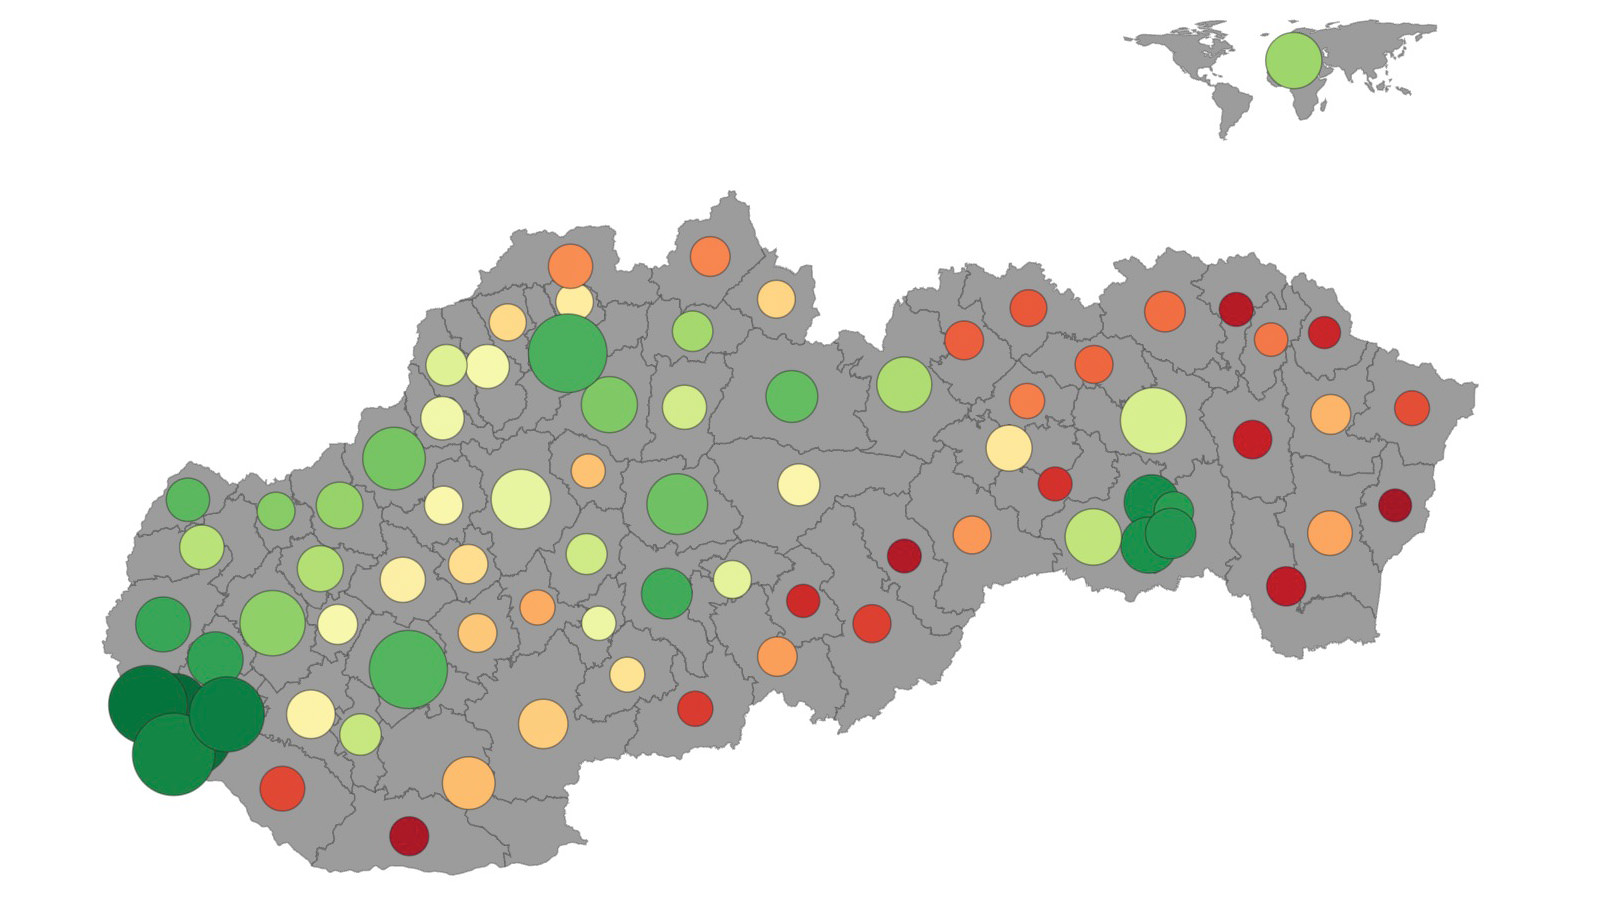
We engineered a custom visualisation tool for Slovak election results. It projects complex data onto an intuitive map, enables granular analysis of voting patterns and serves as a key instrument for strategic planning.
Data Visualisation
The project's objective was to display public election results in a smooth, interactive map visualisation. The challenge was clear: transforming thousands of rows of raw data into an intuitive tool where the client could spot geographic strongholds and patterns at a glance.

Interactive Map
We engineered a custom vector map. It starts with a country overview and enables zooming into regions to see voting results across 2,900 municipalities. The navigation is facilitated by searchable dropdowns to instantly look up any specific district or municipality.

Granular Analysis
Users can choose between viewing the party's overall performance or the preferential votes of a specific candidate. When analysing a candidate, the map enables further comparison of their votes against all valid votes or against the party's result, providing valuable insights for future strategic decisions.